


Trong bài viết này, bạn sẽ thấy những bài mẫu cho các đề IELTS Writing Task 1 có trong bộ đề Cambridge 18 (2023). Các đề thi này đều là đề mới và lạ với người học IELTS, hãy tham khảo các bài mẫu của STUDY4 nhé!
Tất cả bài mẫu của STUDY4 đều được chuẩn bị và chấm bởi Mitchell McKee:
- Cử nhân ngành Ngôn Ngữ Học Tiếng Anh (Đại học Glasgow, Scotland);
- Thạc sĩ ngành Ngôn Ngữ Học Ứng Dụng (Đại học Glasgow, Scotland);
- 3 năm kinh nghiệm giảng dạy và hướng dẫn thi IELTS ở Anh.
I. Đề IELTS Writing Task 1 trong Cambridge 18
Test 1: LINE GRAPH
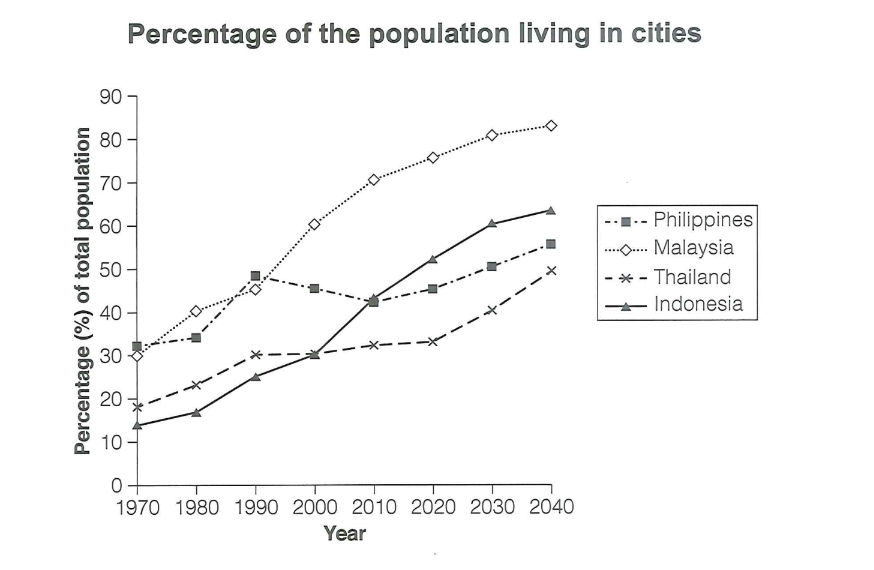
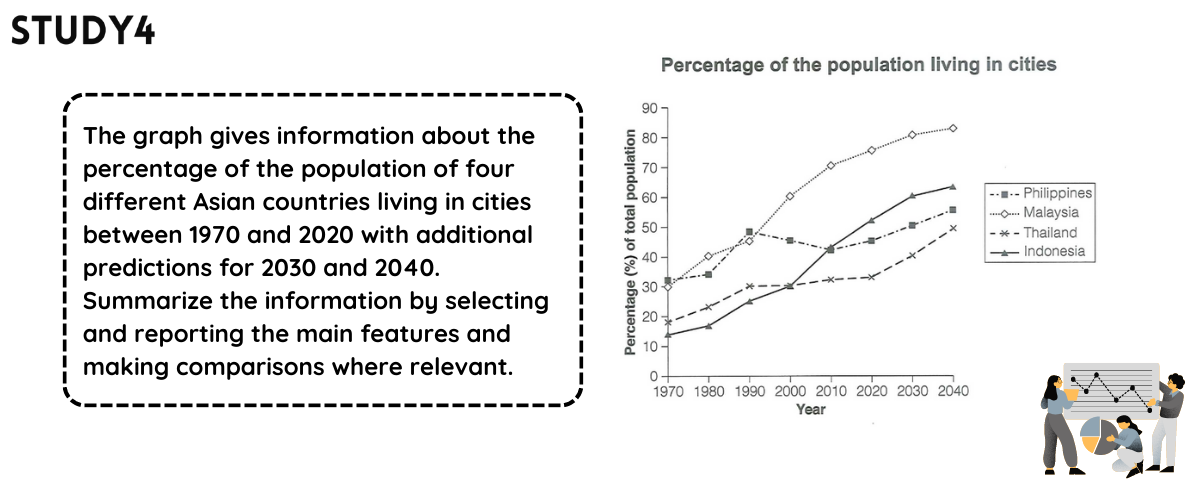
The graph gives information about the percentage of the population of four different Asian countries living in cities between 1970 and 2020 with additional predictions for 2030 and 2040.
Summarize the information by selecting and reporting the main features and making comparisons where relevant.
Test 2: BAR CHART
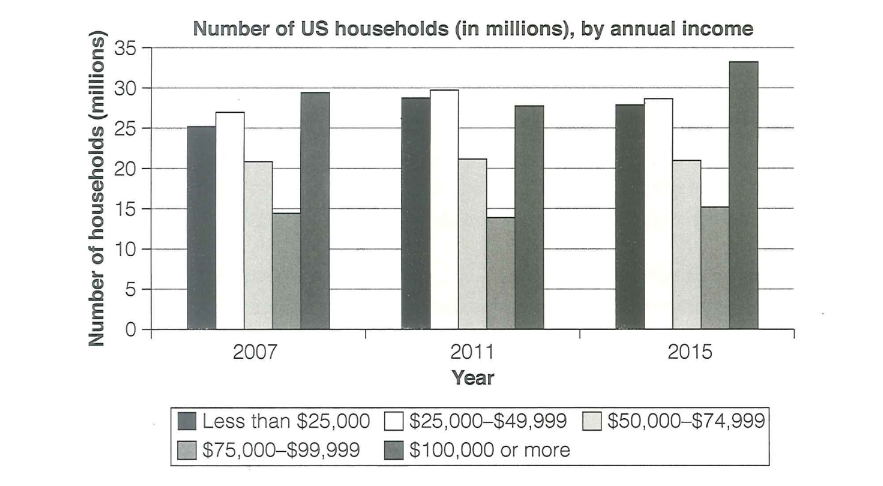
The chart below shows the number of households in the US by their annual income in 2007, 2011, and 2015.
Summarize the information by selecting and reporting the main features and making comparisons where relevant.
Test 3: MAP
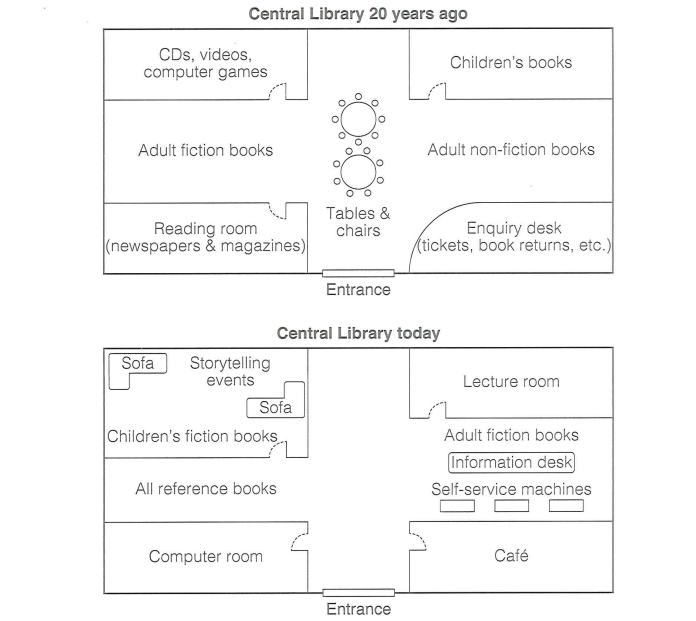
The diagram below shows the floor plan of a public library 20 years ago and how it looks now.
Summarise the information by selecting and reporting the main features, and make comparisons where relevant.
Test 4: LINE GRAPH
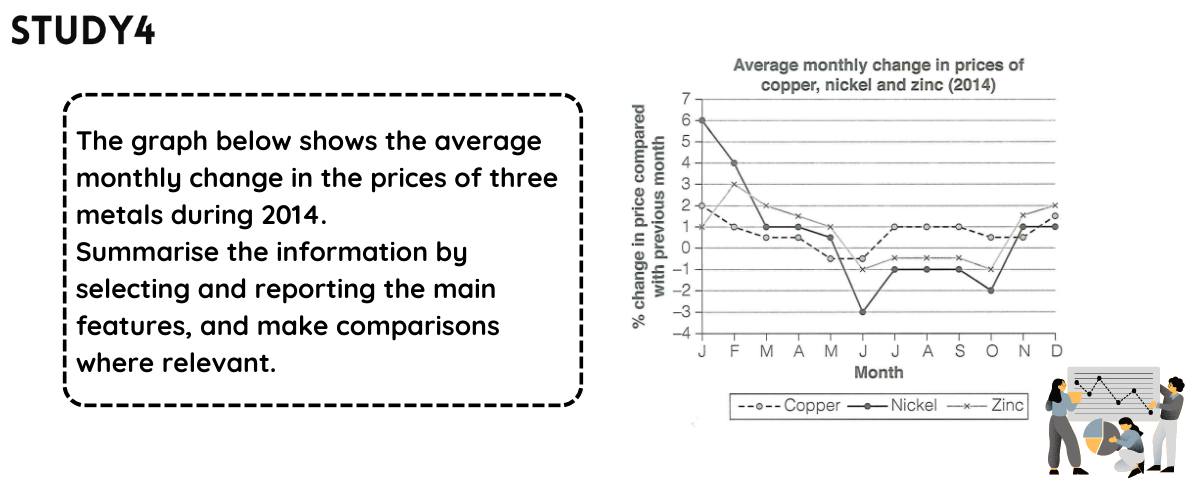
The graph below shows the average monthly change in the prices of three metals during 2014.
Summarise the information by selecting and reporting the main features, and make comparisons where relevant.


II. Bài mẫu band 8.0+
Test 1: LINE GRAPH
Xem thêm phân tích đầy đủ bài mẫu + từ vựng + bài dịch: Bài mẫu IELTS Writing Task 1 Band 8.0+ - Line Graph
Sample:
This line chart shows the population trends in urban residency across four Asian countries from 1970 to 2040.
Overall, it is evident that urban living has witnessed, and will continue to witness, significant growth in all nations, with Malaysia and the Philippines exhibiting the most substantial changes. By the end of 2040, Malaysia is poised to have the highest proportion of its population residing in cities.
What can also be observed is that in 1970, the percentages of urban residents in the Philippines and Malaysia were nearly identical, standing at 31% each. Similar patterns were observed in Thailand and Indonesia, with respective figures of 19% and 12%. Over the subsequent two decades, Malaysia experienced fluctuations in its urban population, surpassing the Philippines around the 40% mark. However, in 1990, Malaysia embarked on a remarkable surge that is anticipated to continue, eventually stabilizing at just above 80% by 2040. In contrast, the Philippines witnessed a moderate decline after 1980, but it is projected to rebound and peak at over 50% in 2040.
Indonesia's statistics for urban residency have shown significant growth, surpassing Thailand in 2000 (at 28%) and the Philippines in 2010 (at 42%). This upward trend is predicted to persist, resulting in Indonesia having the second-highest urban population among all nations, with a final figure of 55%. Finally, Thailand has experienced a gradual and consistent increase, reaching approximately 30% in the present day. A more rapid ascent to over 40% is expected over the next 17 years.
Test 2: BAR CHART

Xem thêm phân tích đầy đủ bài mẫu + từ vựng + bài dịch: Bài mẫu IELTS Writing Task 1 Band 8.0+ - Bar Chart
Sample:
The bar chart compares the number of households in the United States categorized by annual income, for the years 2007, 2011, and 2015.
Overall, upon analyzing the data, it is evident that there is no clear trend in the number of households across various income brackets. Notably, the category with the lowest number of households consistently falls within the $75,000 to $99,999 income range.
In 2007, approximately 25 million households earned less than $25,000 in the United States. This figure experienced a slight increase to around 29 million in 2011, followed by a marginal decrease to 27 million in 2015. A similar pattern emerged for the $25,000 to $49,999 income bracket, which saw an increase from roughly 26 million to 30 million between 2007 and 2011, before dropping to approximately 28 million in 2015.
The number of households within the $50,000 to $74,999 and $75,000 to $99,999 income ranges remained relatively stable across all three years, hovering around 20 million and 15 million respectively. Lastly, households with an annual income exceeding $100,000 declined from just under 30 million in 2007 to approximately 27 million in 2011, only to experience a significant rise to around 33 million in 2015.
👉Ưu đãi giảm giá Combo Advanced IELTS Intensive kèm chấm chữa giáo viên bản ngữ [Tặng khoá TED Talks]
Test 3: MAP

Xem thêm phân tích đầy đủ bài mẫu + từ vựng + bài dịch: Bài mẫu IELTS Writing Task 1 Band 8.0+ - Map
Sample:
The provided maps illustrate the floor plan of a central library two decades ago and its current layout.
Overall, the public library has undergone a complete transformation with room expansions. It is evident that all spaces have been repurposed to incorporate new facilities and accommodate events, with a heightened emphasis on technology.
Twenty years ago, the primary focus of the library was on reading materials. Upon entering, the main area featured a couple of round tables surrounded by chairs. To the right of the entrance, there was an enquiry desk, while the opposite side housed newspapers and magazines for reading. On both sides of the tables, adult fiction and non-fiction books were arranged, while the upper right and left corners were designated for children's books and multimedia materials such as CDs, videos, and computer games, respectively.
Presently, the library building has undergone significant changes. The enquiry desk has been replaced with a newly added café, and the room on the left side of the entrance has been transformed into a computer room. Notably, the tables in the center have been removed, creating a more spacious foyer. The area originally designated for children's books has been converted into a lecture room, and the space between it and the new café now accommodates an information desk flanked by three self-service machines and adult fiction books. It is noteworthy that the former multimedia room has expanded to host storytelling events and showcase children's books, while the reference book collection is now located directly below this area.
Xem thêm: TỔNG HỢP TỪ VỰNG CHO IELTS WRITING TASK 1 (KÈM VÍ DỤ)
Test 4: LINE GRAPH
Xem thêm phân tích đầy đủ bài mẫu + từ vựng + bài dịch: Bài mẫu IELTS Writing Task 1 Band 8.0+ - Line Graph
Sample:
The provided line chart illustrates the fluctuations in monthly prices for copper, nickel, and zinc throughout the year 2014.
Overall, the prices of copper and nickel witnessed declines, with nickel exhibiting the highest volatility among them. On the other hand, zinc experienced a moderate increase. As the period progressed, the changes became less drastic, indicating a stabilization in the market.
In January 2014, nickel exhibited a substantial month-to-month percentage change of 6%, surpassing both copper (2%) and zinc (1%) by a significant margin. However, this trend for nickel reversed in the following months, as the percentage changes dropped to 1% by March and reached a low of -3% by June. The divergences observed in the other metals were comparatively more moderate. Zinc experienced its highest change of 3% in February before entering a declining trend throughout the first half of the year. Similarly, copper prices also declined, with changes mostly ranging around 1% to -1%, slightly lower compared to the other metals.
During the second half of the year, nickel production experienced a decline, with most months seeing a decrease of -1%. However, towards the end of the year, there was a notable upturn as nickel prices rose, resulting in 1% increases. In contrast, copper prices remained relatively steady, hovering around 1% from July onwards, with a slight upward trend observed in December. Zinc, on the other hand, saw a slight decline of 0.5% for the majority of the latter part of the year, but it ended on a high note with a surge of 2% in December. This marked the highest ending point among all metal prices.
Khóa học IELTS INTENSIVE WRITING của STUDY4 giúp bạn thực hành luyện tập IELTS Writing

Khi kết thúc khóa học, bạn sẽ được:
1️⃣ Đạt mục tiêu tối thiểu 6+ trong IELTS Writing.
2️⃣ Làm chủ cách trả lời tất cả các dạng câu hỏi và các chủ đề thường gặp trong Task 1 và 2.
3️⃣ Xây dựng kho từ vựng theo chủ đề cùng những từ/cụm từ nối câu, liên kết ý hiệu quả.
4️⃣ Nắm chắc ngữ pháp, biết cách xác định và sửa những lỗi ngữ pháp thường gặp khi viết luận.
CÓ GÌ TẠI KHÓA HỌC CỦA STUDY4?
🔍Phân tích chi tiết essay sample: Mỗi bài viết task 1 và task 2 đều được phân tích chi tiết vai trò của từng câu để bạn nắm được công thức phát triển ý trong một đoạn và sắp xếp đoạn trong một bài. Ngoài ra, từ mới kèm nghĩa tiếng Việt, các từ và cụm từ liên kết ý, liên kết đoạn được highlight để bạn dễ dàng học tập.

📓Luyện tập từ vựng: Để nắm được cách sử dụng từ mới trong IELTS Writing, mỗi bài viết đều có thêm phần luyện tập điền từ đã học.

📒Luyện tập sử dụng liên kết câu và thực hành chữa lỗi ngữ pháp: Bài tập điền từ hoặc cụm từ liên kết phù hợp giúp bạn nắm chắc cách sử dụng không chỉ các từ, cụm từ liên kết mà cả đại từ thay thế. Bài tập chữa lỗi ngữ pháp giúp bạn hạn chế được các lỗi sai thường gặp khi viết luận.
✍Thực hành viết lại câu: Bạn sẽ tập viết lại câu để nắm được vai trò câu trong một đoạn và cách xây dựng một bài viết hoàn chỉnh.
Lời kết
Mong rằng bài viết giải đề Writing Task 1 cho bộ đề Cambridge IELTS 18 (2023) của STUDY4 đã giúp bạn có thêm các cách giải quyết các đề thi trong sách. Hãy kiên trì luyện đề thật nhiều và nhất định bạn sẽ nhận được thành quả xứng đáng!
Nếu có thắc mắc, hãy để lại bình luận và STUDY4 sẽ giải đáp cho bạn nhé!


Bình luận
Vui lòng đăng nhập để comment